Taste
New
York

We know that New York's air is polluted, but detailed air quality data is frequently presented in units (e.g., "parts per billion") that are abstract and difficult to understand. The TASTE recipe takes the summer 2018 air pollution data and concocts a tea that captures the unique combination of pollutants in each neighborhood. Taste the difference in pollution levels with #bigapplerecipes.

Data

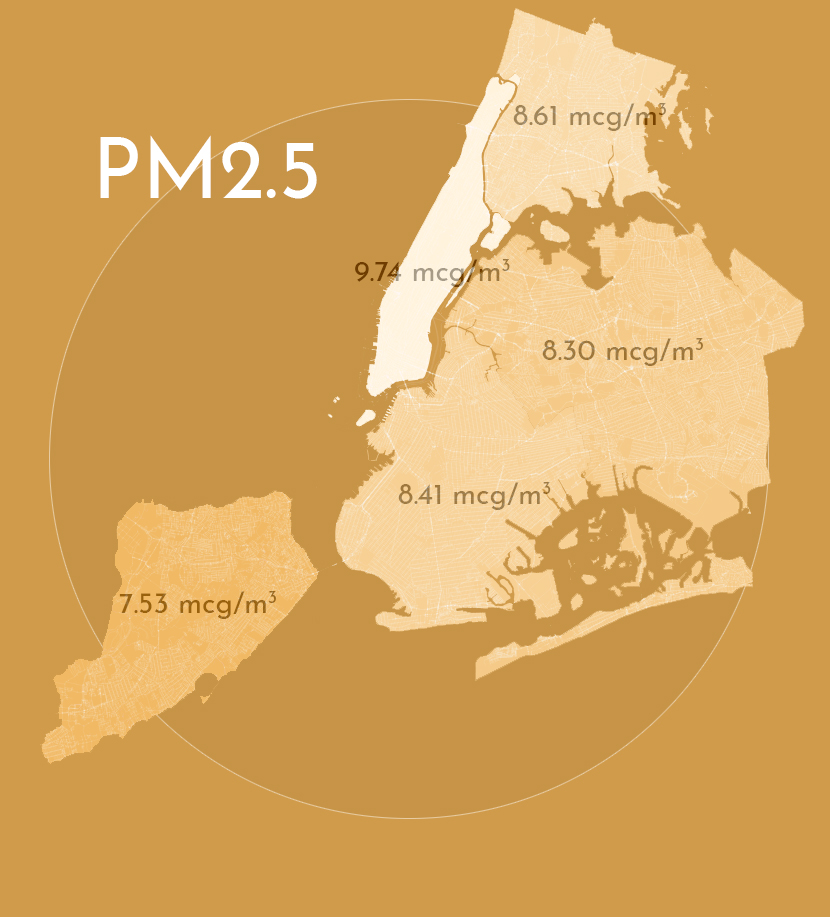
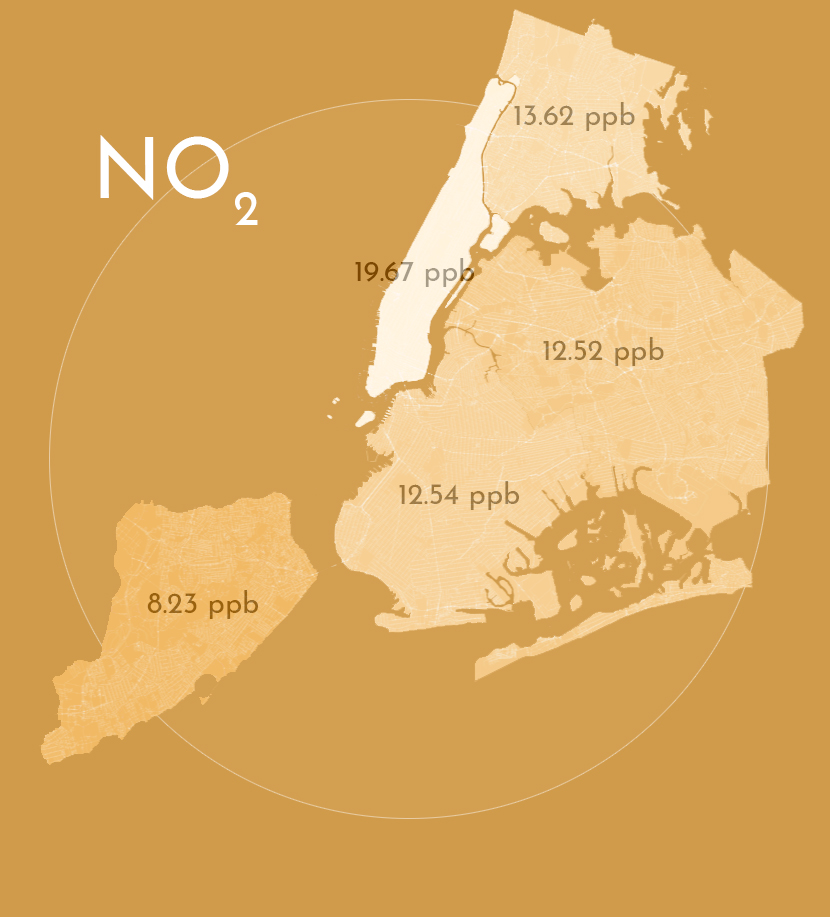
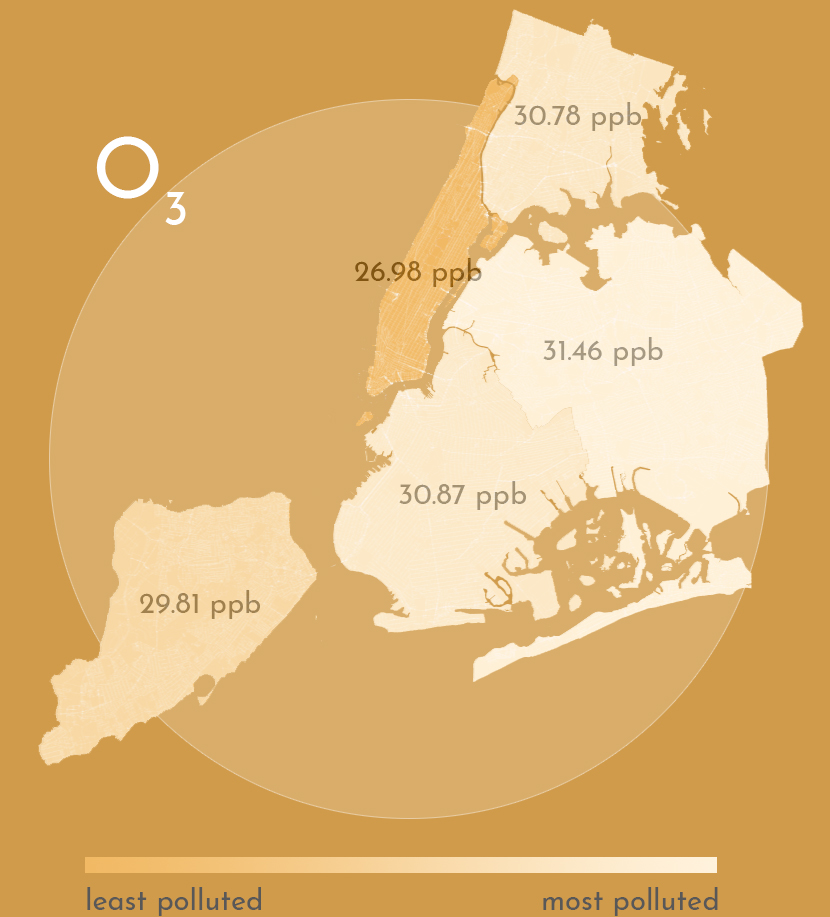
Air pollution data is important to a city's health, but the information is difficult to intuitively understand. The three metrics presented here are often used as indicators of air quality. NO2 is mostly a result of car emisions, so it's not surprising that Manhattan is more heavily afflicted. Ozone (O3), on the other hand, is produced indirectly through reactions involving NO2 and other nitrogen oxides. Because fresh NO2 emissions reacts with and removes ozone, Manhattan is less polluted with O3 than, say, Queens.
Data source: Air Quality

Recipe


Beverage

Honey

Ginger

Lemon Juice
The Bronx 34 tbsp and a dash 1 18 tsp 1 34 tbsp
The Brooklyn 34 tbsp 1 18 tsp 1 34 tbsp
The Manhattan 1 14 tbsp 1 14 tsp 1 12 tbsp
The Queens 34 tbsp 1 18 tsp 1 34 tbsp
The Staten Island 12 tbsp 1 tsp 1 12 tbsp and 12 tsp

In a small pot, mix honey, finely chopped ginger, and freshly squeezed lemon juice with 1.5 cup of water. Bring the mixture to a boil and let simmer for 5 minutes. Drain into a mug and enjoy your beverage!

This recipe translates nitrogen dioxide (NO2) into honey, fine particulate matter (PM 2.5) into ginger, and ozone (O3) into lemon juice. It creates a beverage that is about 2 billions times more concentrated than the typical air pollution levels in New York. Through small variations in the quantity of the ingredients, each borough's tea adopts a slightly different flavor note that refelcts its air quality.

Performance